
VisAmUrb is a start-up, interdisciplinary research project (AAU-CRENAU/LS2N/ Sustainable Cities Design Lab) on the visualisation of urban data for urban design.
Winner of the 2016 call for research projects
3 partners:
- AAU-CRENAU
- LS2N-IPI
- Sustainable Cities Design Lab
About the project
Understanding the complex situations involved in urban design is very challenging due to the broad range of information, with both a spatial and temporal component, which needs to be taken into account.
This information is represented in computerised systems through spatio-temporal data with highly heterogeneous characteristics. Stakeholders in urban planning have to work with increasing numbers of maps, graphs, analyses and summaries that are biased, incomplete and sometimes even a distortion of the reality on the ground. To be fully aware of both what the data means and how the phenomena they represent interact, it is therefore essential to integrate data into one or several reliable representations. Moreover, these representations need to be used in real situations to be able to test their relevance and improve the ideation process.
Results
Interviews with urban planning stakeholders: a tool has been created to help participants identify stakeholders, their involvement and the data used at different stages in the development of urban projects.
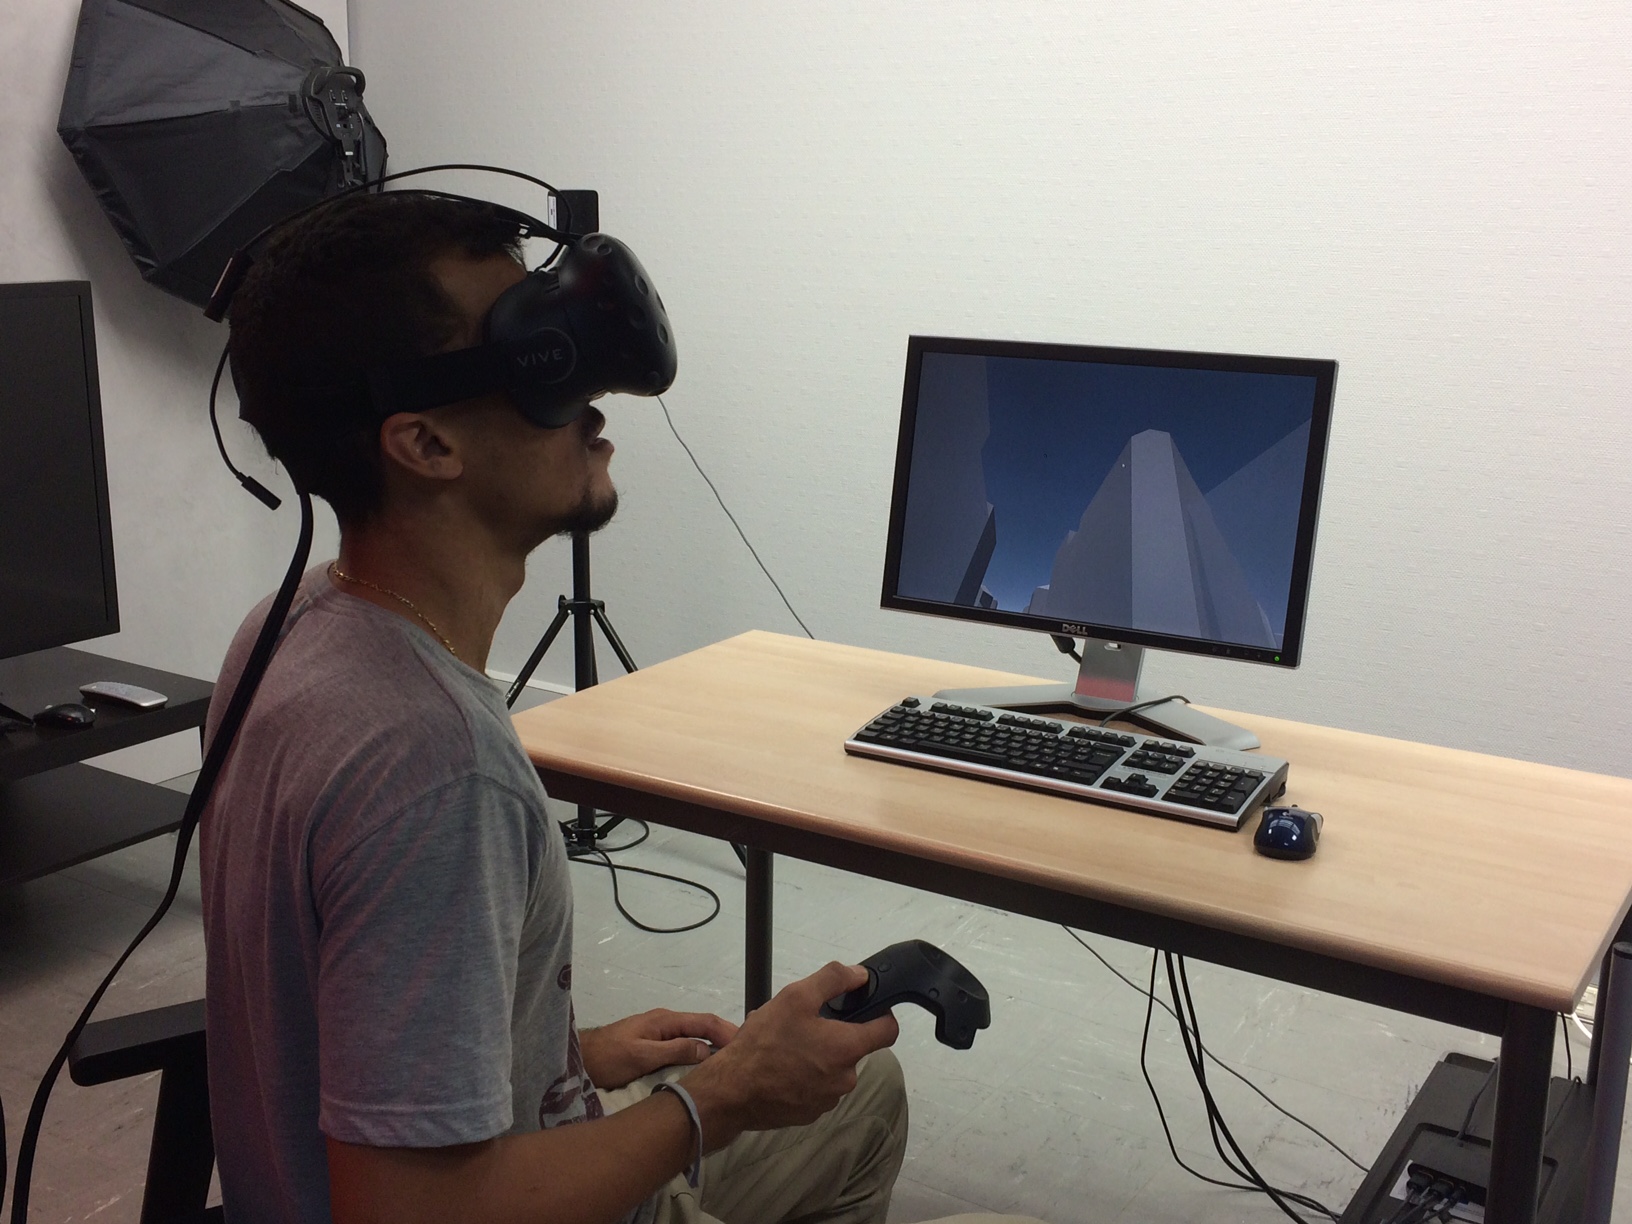
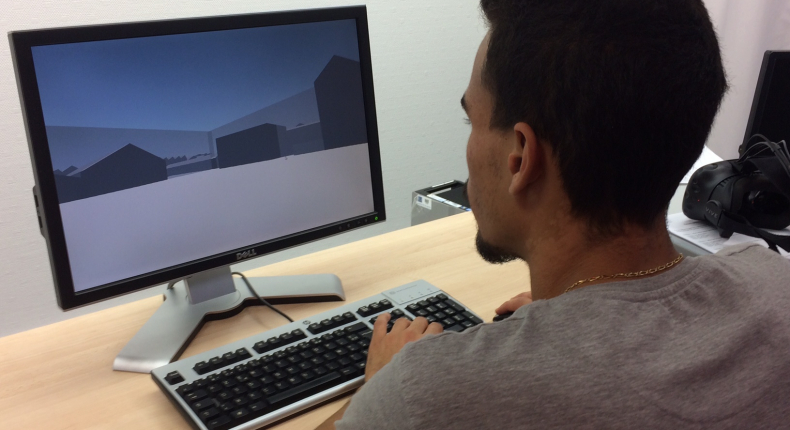
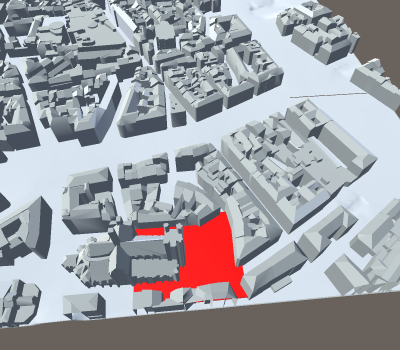
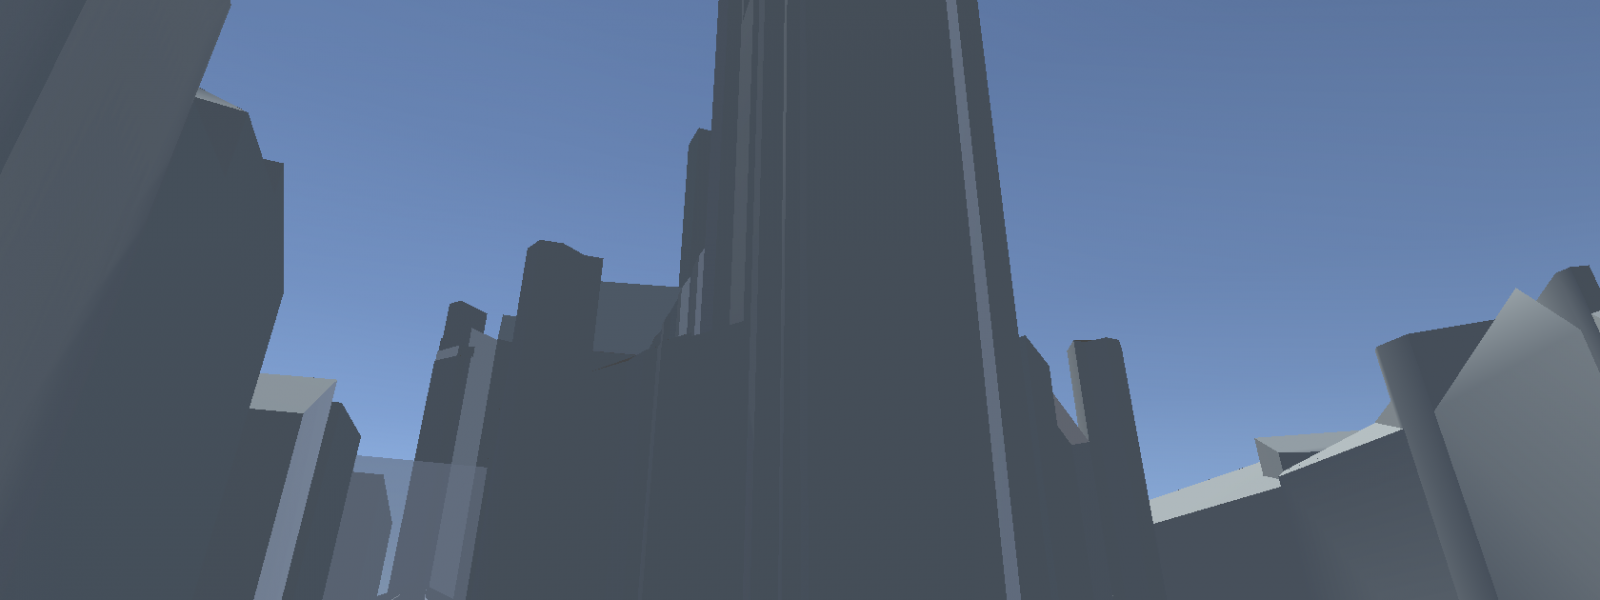
Density of the built environment: a method for calculating the isovist field in 3-D. The surfaces of buildings as seen by a pedestrian walking along a route were implemented on Unity3D to calculate objective parameters for describing an area. This was followed by a controlled experiment to assess perceptions of the density of the built environment with two display modes: headset/screen, and from two positions: pedestrian/aerial view.
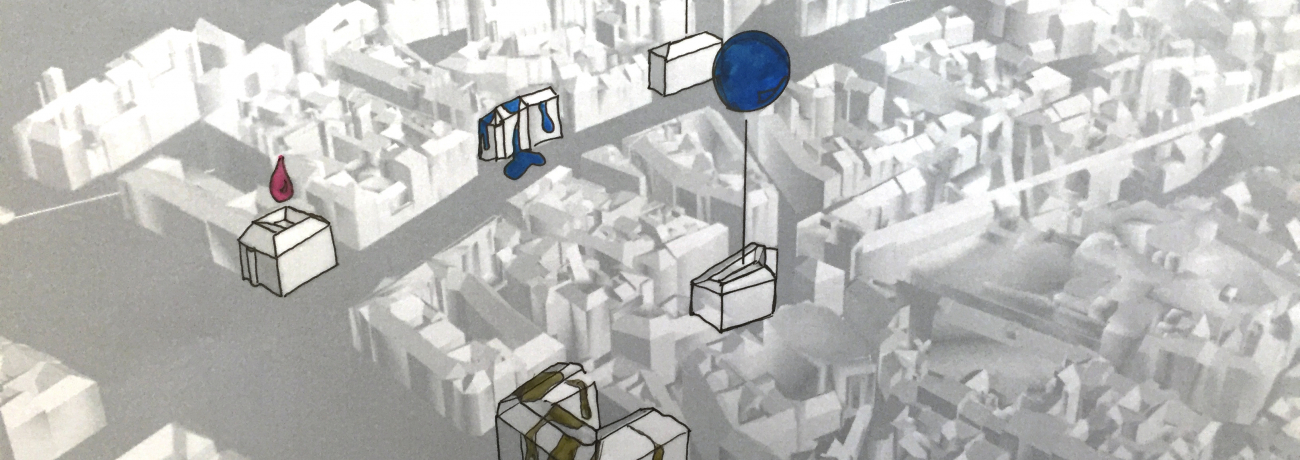
Ideation workshop: (with students from the École de design Nantes Atlantique). This workshop on displaying and identifying urban data engaged students from the Sustainable Cities Masters cycle in working on the following themes: past and present/citizens’ opinions/urban atmospheres.
Publications and/or communications
Toinon Vigier, Maxime Ameil, Vincent Tourre, “Impact of visual immersion on perception of urban morphology and density in 3D city models”. VSMM2017 – 23rd Int’l Conference on Virtual Systems and Multimedia
Maxim Spur, Vincent Tourre, Jimmy Coppin, “Virtually Physical Presentation of Data Layers for Spatiotemporal Urban Data Visualization” . VSMM2017 – 23rd Int’l Conference on Virtual Systems and Multimedia
Prospects
The results from the project will be used in further research on creating an urban data visualisation tool, carried out by a doctoral student at AAU-CRENAU with joint supervision from LS2N-IPI. It stands to reason that interviews and studies into the criteria for evaluating the objective and subjective qualities of the urban fabric, should involve a multidisciplinary approach. Studies involving analysis of perception and evaluation of user experiences of interaction with different modes of urban visualisation are also a possibility. There are plans to respond to national and regional calls for projects in the autumn of 2017.
Schedule
Spring 2017: interviews with stakeholders in urban planning
Summer 2017: method for calculating the isovist field in 3-D. First evaluation experiments (urban density)
Autumn 2017: ideation workshop, second evaluation experiments (density while following a route), partial presentation of results at the VSMM2017 conference.
Winter 2017: full presentation of results
Contacts
Vincent Tourre vincent.tourre@ec-nantes.fr
Guillaume Moreau guillaume.moreau@ec-nantes.fr
Patrick Le Callet patrick.le-callet@univ-nantes.fr
Toinon Vigier toinon.vigier@univ-nantes.fr
Florent Orsoni f.orsoni@lecolededesign.com
Hilda Zara h.zara@lecolededesign.com